Prove your impact with evidence.
For universities and policy teams who need faster, fuller, and more credible evidence of real-world outcomes, especially the kind that secures future funding.
- Burning goodwill through surveys
- Paying for expensive impact reports
- A handful of anecdotal case studies
- Limited to generic financial outcomes
- Static snapshot in time
- Finding latent evidence already online
- Export impact charts with a click
- Instant case studies for all your projects
- Custom metrics: capability, media, utilisations, etc.
- Real-time and gets better over time
Real questions, answered with evidence.
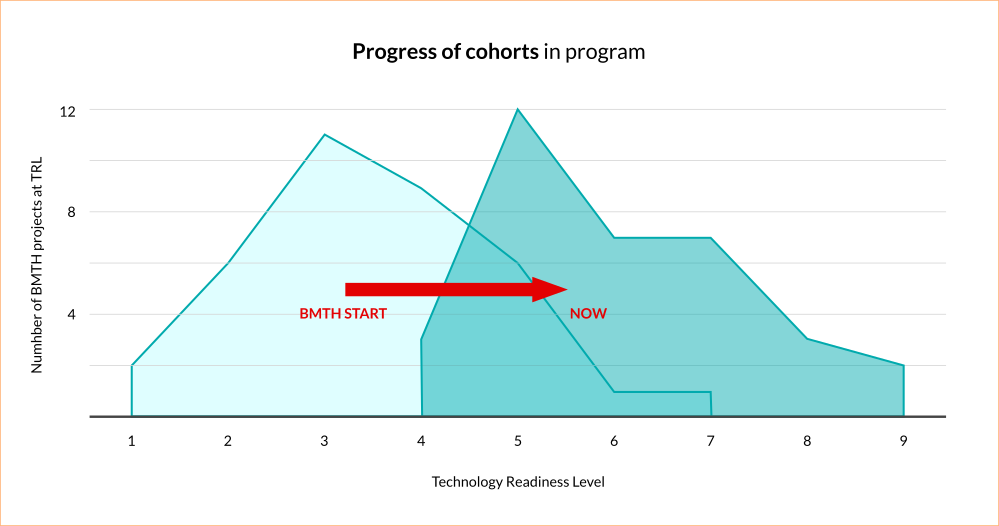
Data that Makes Your Point
The stated goal of BioMedTech Horizons was to bridge the valley of death. So we designed a chart that did exactly that.
Horiz-in builds flexible, narrative-aligned charts and visualisations tailored to your exact messaging goals.
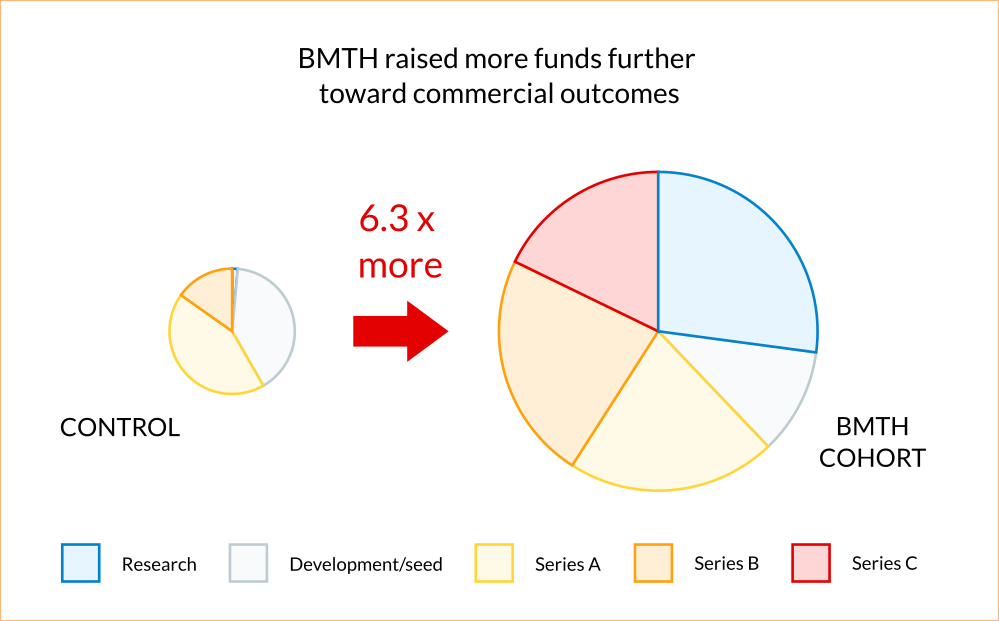
Compare to a Control
We showed that funded projects raised 6.5× more follow-on funding than those rejected from the program.
By tracking public information, our approach allows us to perform customised control group comparisons.
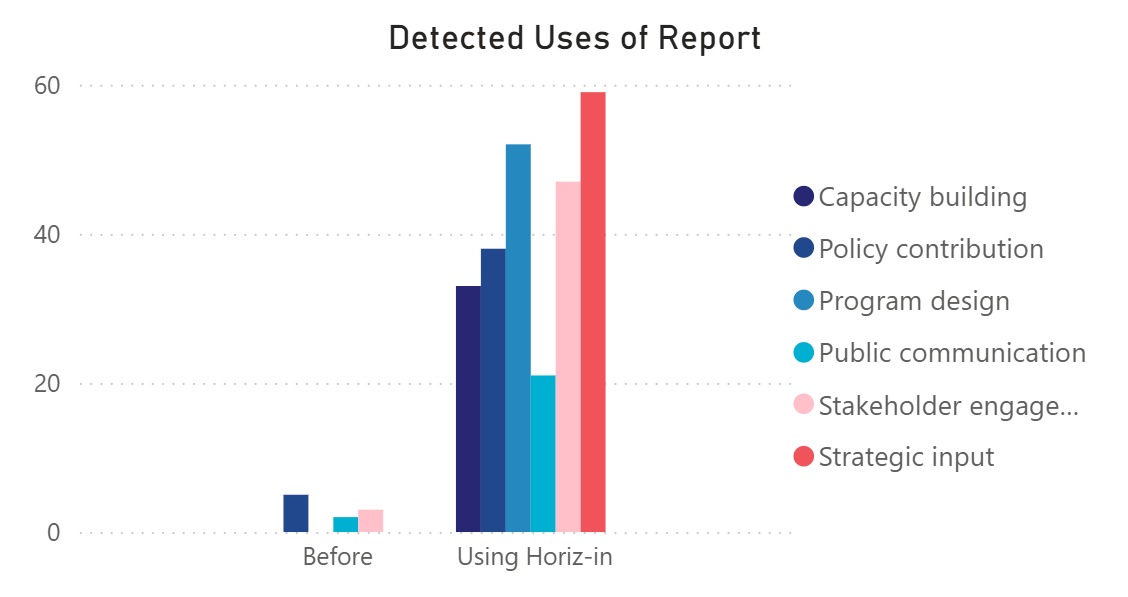
Stop Underestimating
In two weeks we detected 15x more examples of the outputs of a Federal Government agency being utilized than the agency had found in three years of operation.*
Our custom tracking allows previously unmeasurable things to become measurable.
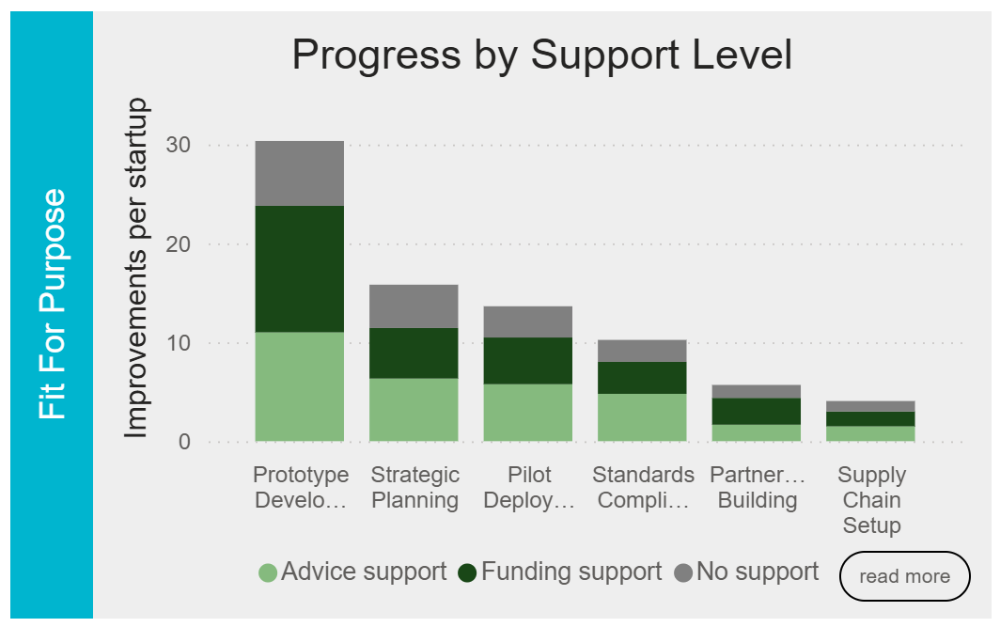
Complement Existing Data
We cross-cut 4,000 development improvements against a national support agency's internal support records to show how their support led to outcomes.*
It's easy to merge and enrich your existing data to get something more than the sum of its parts.
* Data in chart has been modified to de-identify the client.

"Horiz-in's data allowed us to succeed in bids for funding programs. They provided helpful metrics that showed the economic impact of our accelerator programs through control group analyses."
Chief Operating Officer, MTPConnect

Ready to prove your impact?
Tell us what you need to show. We'll help you find the shape of the answer.